Since 2019, the Department of Neighborhood Empowerment has considered data as an asset for community efforts and therefore developed useful resources and tools to help community leaders in their advocacy strategy and their decision-making process. Below, you will find maps, applications, dashboards and others links that will help you better understand the different facets of your community. If you would like to see additional tools developed, contact data@empowerla.org.
Find Your Neighborhood Council & Other NC Resources
New to data and Neighborhood Councils? Start by using our ‘Find My Neighborhood Council’ map application to find your Neighborhood Council and other relevant information. Additionally, you can explore the ‘Know Your Community’ Platform for a deeper look into your community, from local event information to the status updates on city services.
Enter your address in the search bar (at the top left corner), then click on the colored area of your location to see your Neighborhood Council name and corresponding information, such as which Council district and 2020/21 NC Elections information. Click here to access the map application in a new window.

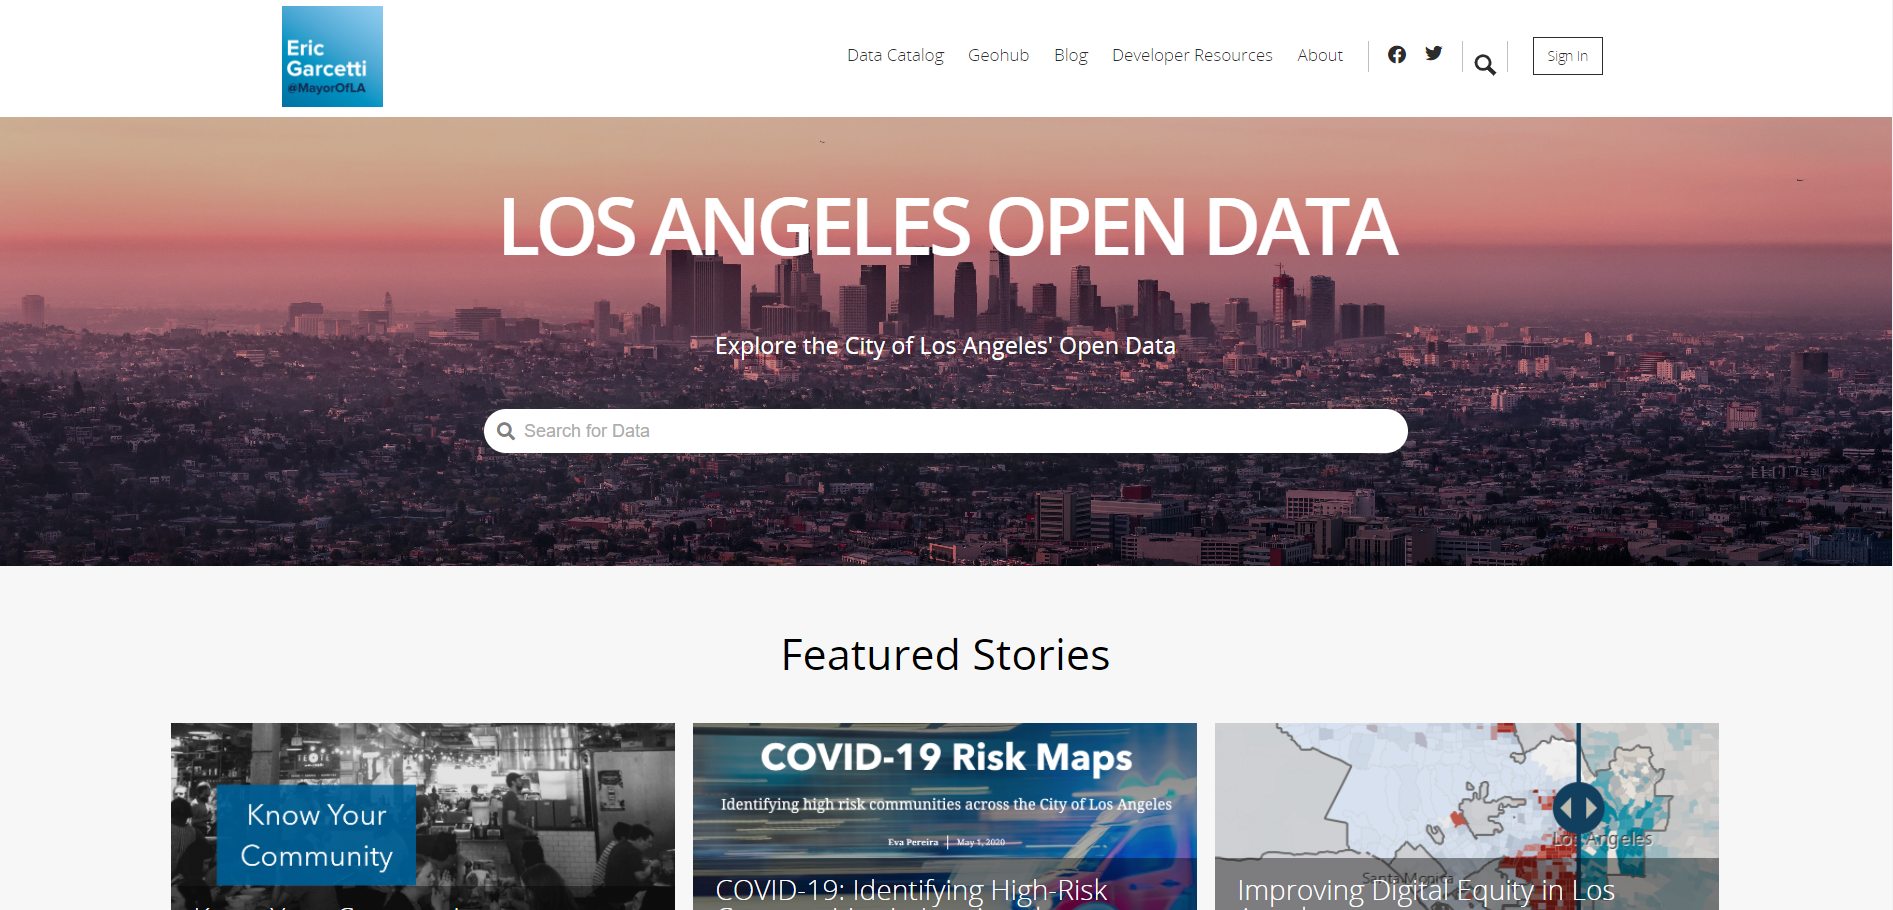
Developed in partnership with the Mayor’s Office, the ‘Know Your Community’ platform gives you access to a variety of data tools for a deeper dive into your community. On the platform you can find a range of useful information, from building and safety permits in your locale, to resilience indicators within your Neighborhood Council, to open 311 requests. Find out more and explore the many other data resources and ongoing initiatives tied to knowing more about your community.
Enter your address in the search bar (at the top left corner), then click on the colored area of your location to see your Neighborhood Council name and which City Council district(s) it belongs to. Click here to access the map application in a new window.
Neighborhood Council Dashboard and Reports
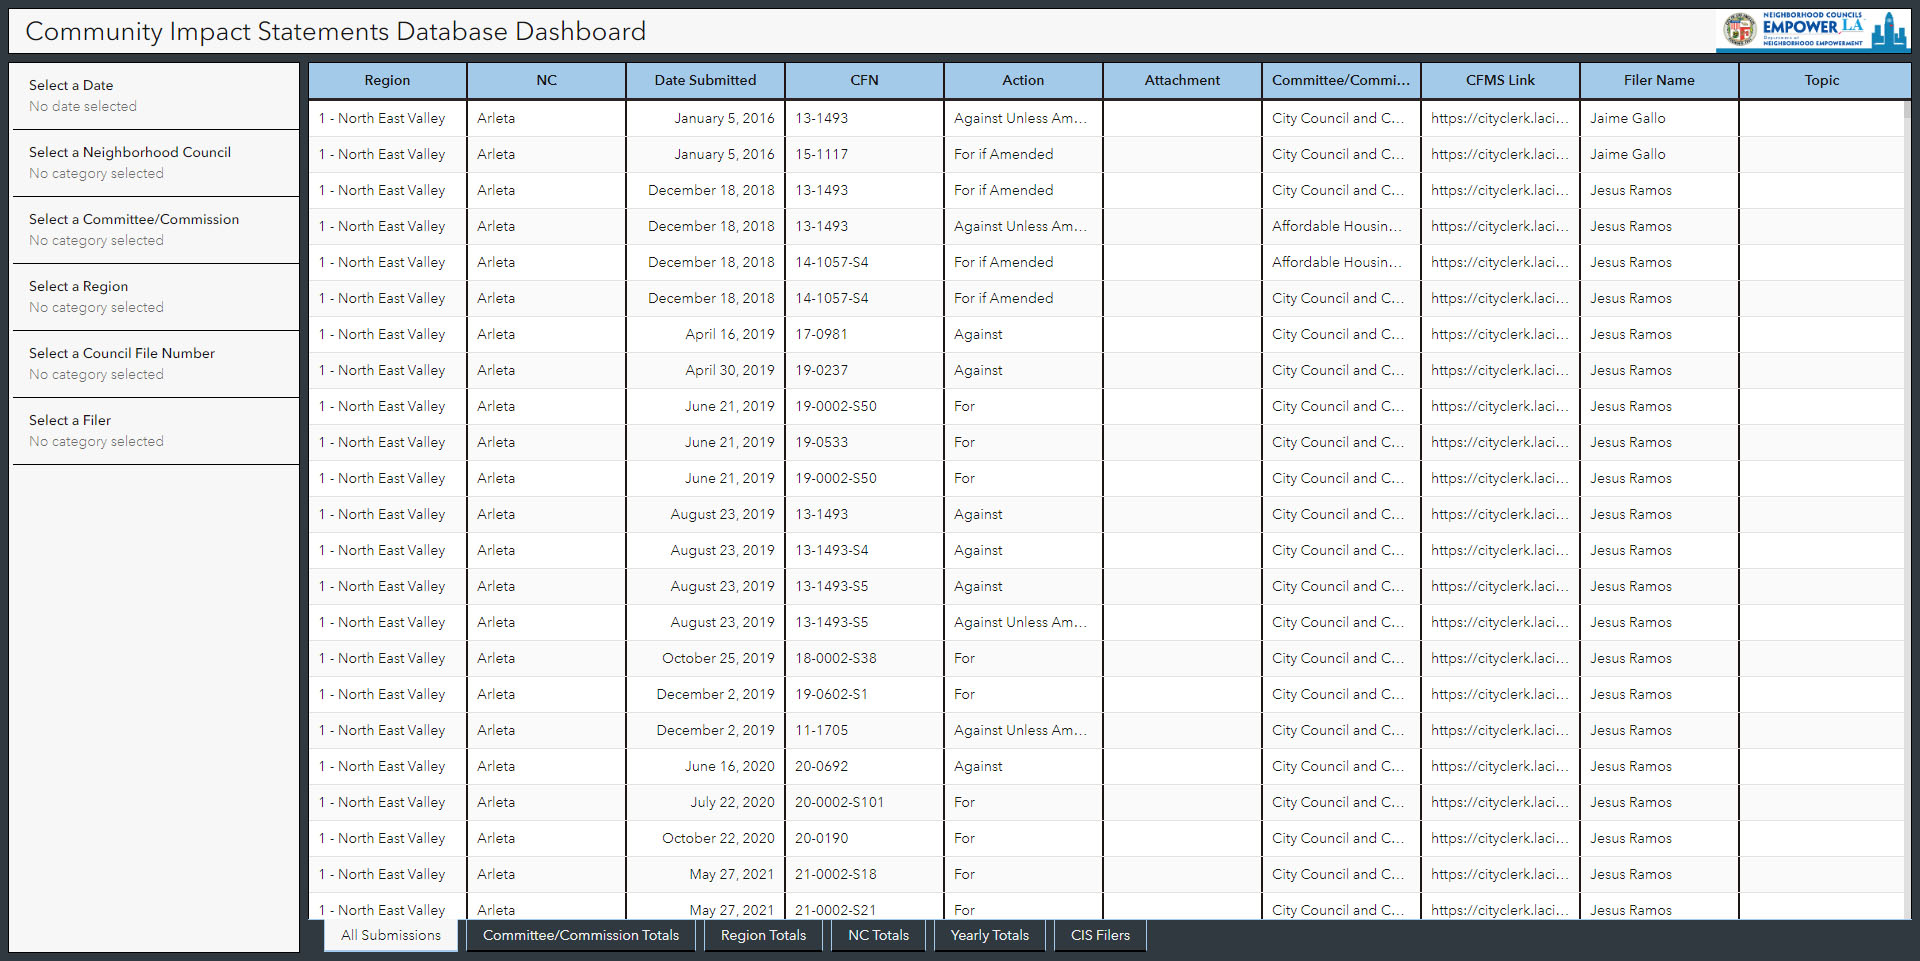
Some of the ways you can use this dashboard include:
- Links to the council file management system
- Ability to search and filter by specific dates and date ranges, council file numbers, neighborhood councils, regions, committees/commissions, topic title, action type, and filer name
- Attachments (PDF) that accompany the specific CIS submission
- A downloadable spreadsheet database
Here is a handy guide for a better understanding of the features of this dashboard. You can also email us at cis@empowerla.org for support.
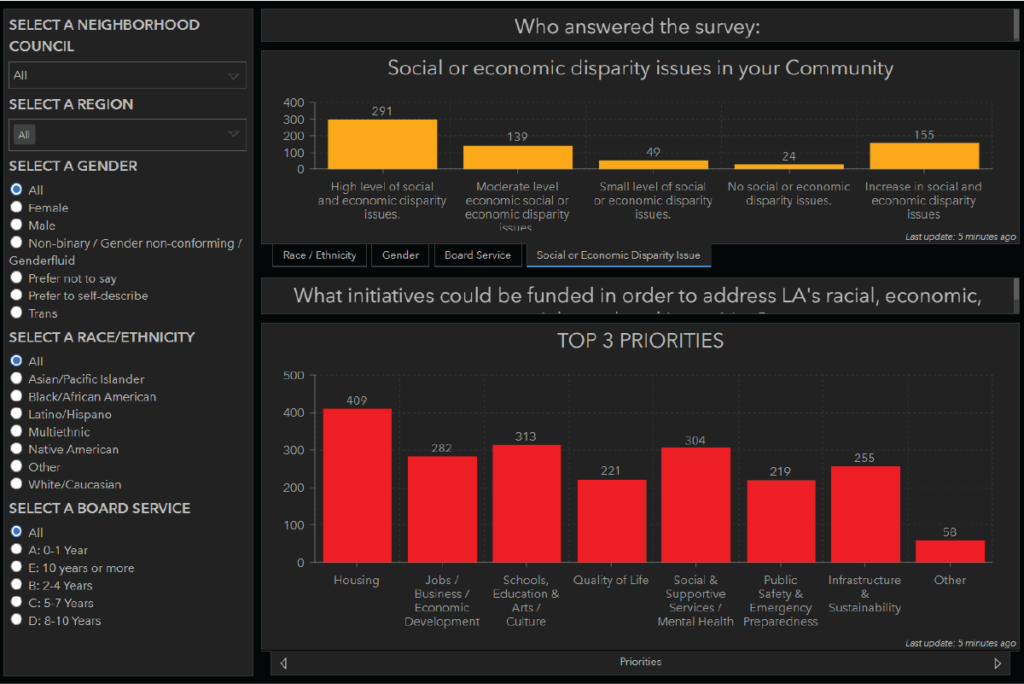
Following Mayor Eric Garcetti’s Executive Order (signed on June 19, 2020) calling for racial equity in City government, the Department responded by administering a survey of NC board members to poll their views of social and economic disparities in the communities they serve. You can read more about the Social and Economic Inclusiveness and Equity (SEIE) survey here. This dashboard was created to share some highlights gathered from the survey responses.
(NC experiences with EmpowerLA)
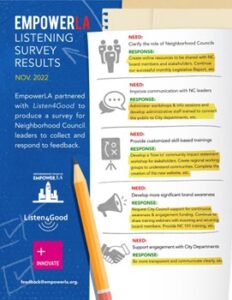
The EmpowerLA Listening Survey report reflects a desire from neighborhood councils for the following:
- More support from the Department and during NC meetings (49.81%).
- Training in empowered virtual governance (EVG) and its implementation.
- More training sessions and role-playing to develop and improve skills
- When asked how EmpowerLA can serve them better, 49.81% of respondents would like more 1:1 sessions with board members and 47% would like more town halls with the NCs in different neighborhoods.
- NCs definitely want to interact more with the NEAs with 40% wanting them to attend more meetings.
Awareness and Engagement Survey
(The Public’s Experience with NCs)
EmpowerLA conducted a Neighborhood Council Awareness and Engagement survey of City of Los Angeles residents from October 2021 – January 2022. The EmpowerLA Awareness & Engagement survey is an outreach survey. The primary objective was to outreach to as many residents as possible and provide an opportunity for residents to share their views, as well as their awareness of, and engagement with, Neighborhood Councils.
We contacted LA County-registered voters with an available email, as well as Neighborhood Council board members, and people who requested ballots in the 2021 NC elections. This survey enlisted community feedback from as broad an audience as possible. In addition, it provides input on the respondents’ understanding of their more extensive experience with Neighborhood Councils.
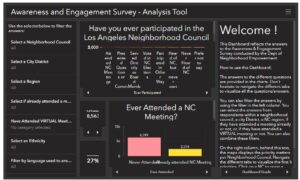
The interactive tool presenting results from the Awareness & Engagement survey with demographic crosstabs displays the survey results, viewable by City Council districts, by Neighborhood Council region, and by Neighborhood Council.
At the March 1, 2022 Board of Neighborhood Commissioners meeting, the Department presented a summary of the EmpowerLA Awareness & Engagement survey. The slide deck from that presentation is below.
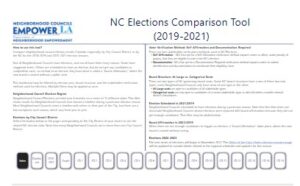
Compare the Neighborhood Council Elections results Citywide, regionally, by City Council district, or by the Neighborhood Council for the 2018-19 and 2020-21 election seasons. This interactive dashboard can be filtered by election year, board structure, and stakeholder verification method.
City Data Resources
Sharing Data with the public increases transparency, accountability and customer service. Use the data available to understand more deeply how the city works.
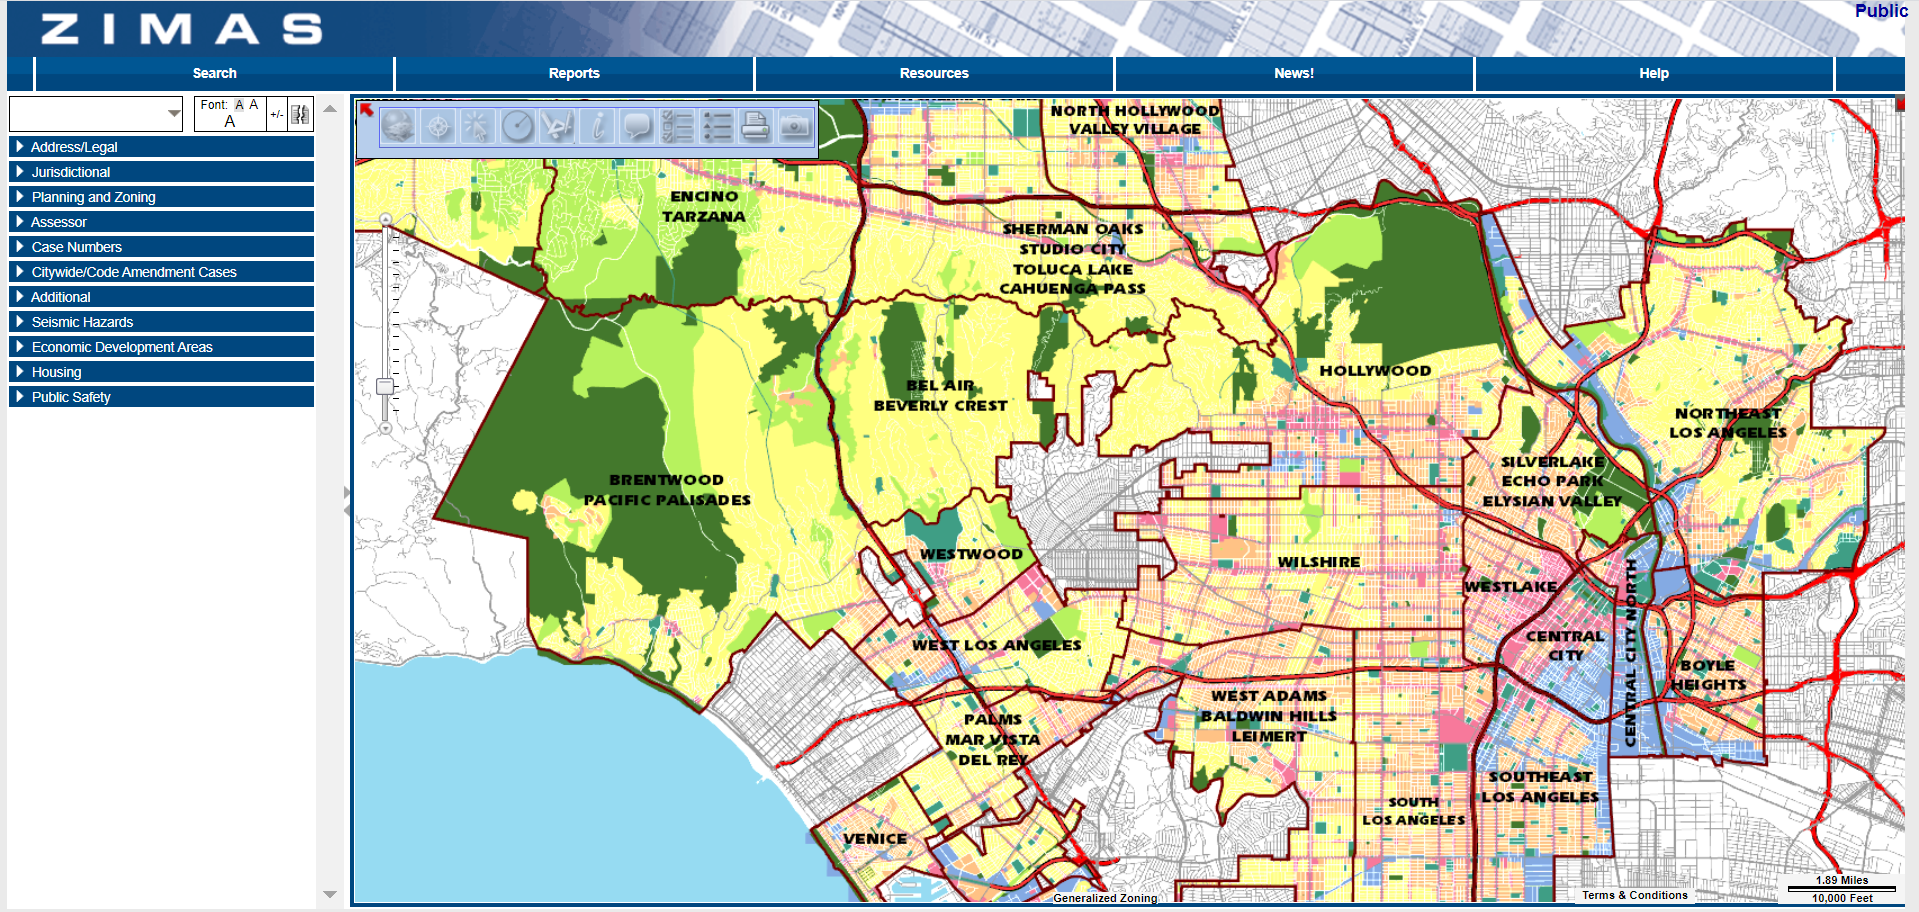
The ZIMAS application is designed to provide zoning related information for specific properties. The application offers a variety of different options for accessing and displaying property specific information. Click here to download a Step-By-Guide for Using Zimas.
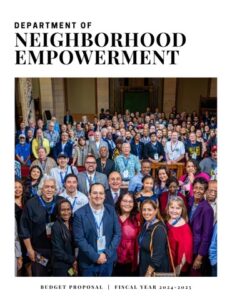
City Departments submitted their proposed budgets for Fiscal Year 2024-2025. We have provided access to a page with each Department’s proposed budget submittal.
Click here to review the Budget Proposal.
Have you ever wondered how fast 311 requests are closed in your neighborhood compared with another? Or how many 311 requests were reported in the last week around your area? Find out and review the 311 Data website. This site seeks to help improve understanding and ease of use of 311 data at the neighborhood level.
Neighborhood Council Demographic Data
Explore the Demographic Dashboard, an interactive digital tool that breaks down the demographic information for each Neighborhood Council. Demographic information includes gender, age, language-spoken, race, housing, income & poverty levels, and education.
Additionally, the same data is displayed in the Demographic Data Sheets. These one-pagers, also by Neighborhood Council, can be downloaded/printed to be easily shared for your convenience.
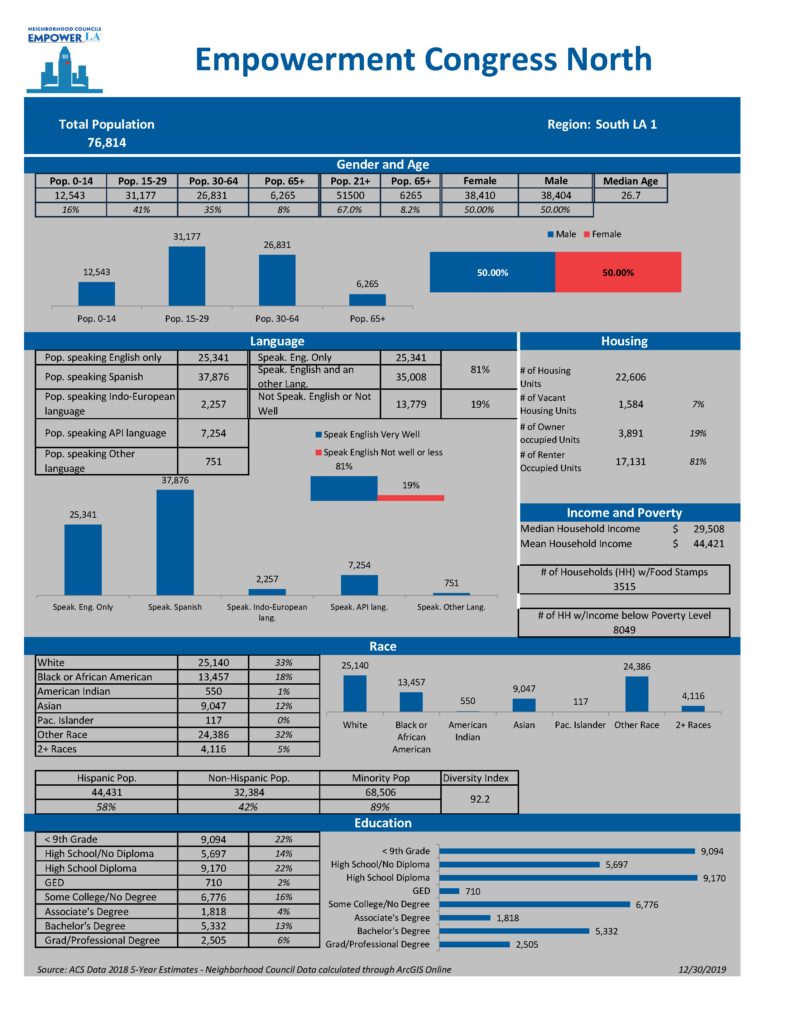
Displayed is a preview of a sample Demographic Data Sheet for Empowerment Congress North. Find all the Neighborhood Council Demographic Data Sheets by clicking the button below, which links out a google drive, listing all the data sheets in descending alphabetical order.
Learn more about the percentage of population that is Spanish speaking and Non-English speaking. Click here to access the map application in a new window.
About the Data Literacy Program
In-Person workshop dedicated to the general public. No specific computer science knowledge is required. Laptops are provided to people who don’t possess their own equipment. Translation is available upon request.
Due to to COVID-19, the in-person workshops are currently suspended. The Department is working on providing virtual sessions and will keep you informed once they are available.
Data Liaisons are appointed by their Neighborhood Council and will be trained by the Department and the Office of the Mayor Eric Garcetti. Equipped with their new skills, Data Liaisons will be able to design maps, create data visualizations for digital outreach, highlight community issues, create surveys and map the data to build innovative, informative, and strategic resources to advocate for their community. Each Neighborhood Council can appoint 1-3 Data Liaisons. This learning path requires a higher level of computer skills and some of the ArcGIS resources may only be available in English.
The Los Angeles GeoHub’s purpose is to unlock the City’s Geodata. Anyone can use the open data in the GeoHub at no cost. Download raw data and share your insights with your community or build new applications that serve specific users.
You can create an account on the GeoHub to access powerful GIS tools. The video below will guide you on how to create a Los Angeles GeoHub account. You can also use this step-by-step guide: Creating a LA GeoHub Account.


